Highlights
-
Bradenton tightened with nearly unchanged closings, making lower inventory the main shift.
-
A slightly higher median and lower average showed mixed pricing.
-
Available inventory declined, reducing competition among sellers.
-
Marketing time shortened and matched the county pace closely.
-
Sellers gained support from supply, but stable sales limited evidence of accelerating activity.
Market Conditions
Bradenton moved toward balanced-to-seller-leaning conditions in September 2026. Its 3.9 months of supply was slightly above the county. Nearly steady closings and fewer listings tightened the reported city market, which remains distinct from the Central Manatee & Bradenton HLA.
The figures combine single-family homes, condos, townhomes, and villas, with year-over-year comparisons to September 2025.
The local supply reading compares with 3.5 months in Manatee County.
Pricing Trends
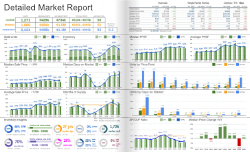
The median sale price increased 1.2%, from $415,000 to $420,000. The average declined 4.2%, from $502,000 to $481,000. The median marks the midpoint of sales; the average gives expensive transactions more influence.
The median rose 1.2%, matching the county’s percentage increase and its $420,000 price level. The average declined 4.2%, contrasting with the county’s increase. The split may reflect a different sales mix and does not establish uniform appreciation or decline.
Inventory Trends
Available inventory declined 18.3%, from 2,071 to 1,692 properties. Months of supply declined from 5.2 to 3.9.
Buyers had 379 fewer listings to compare. The inventory contraction exceeded the county’s 10.3% decline, but the slightly higher local supply reading still provided more choice relative to the source’s sales pace.
Market Pace
Closed sales declined 0.5%, from 386 to 384. Median days on market fell from 73 to 52 days. Closed sales measure completed transactions rather than new contracts.
The 52-day median improved 21 days and was close to the county’s 53 days. Closings declined only 0.5%. The improvement was primarily faster marketing and reduced listing competition rather than growth in completed activity.
What This Means for Buyers
Buyers have fewer alternatives and a shorter typical marketing period than last September. Compare matching city sales to judge the mixed price measures. A prompt decision on a good match can coexist with negotiation based on the property’s competing listings.
What This Means for Sellers
Sellers benefit from less competition and faster marketing time. Nearly steady closings and the lower average call for measured pricing. Use comparable completed sales and realistic preparation rather than assume tighter supply guarantees a higher sale price.