THE ZARGHAMI REPORT

SARASOTA’S MOST CURRENT AND RELEVANT REAL ESTATE MARKET INFORMATION

Sarasota Luxury Market Report

JULY 2026

Market data for Sarasota County properties priced in the 10th percentile.
Updated August 5, 2026

Highlights

  • Sarasota’s luxury market improved as sales increased and inventory declined, but conditions remained more favorable to buyers than the county overall.
  • Higher average pricing suggests that more ultra-luxury properties closed during July, rather than indicating uniform appreciation across the segment.
  • Buyers continued to benefit from meaningful selection and longer marketing times.
  • Sellers faced less competition than one year ago, although luxury homes still required patience and precise positioning.
  • The market was stabilizing, with stronger demand offset by elevated supply and slower sales velocity.

Market Conditions

Sarasota County’s luxury market strengthened in July 2026, but it remained slower and more buyer-leaning than the broader county market.

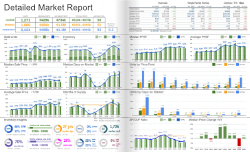
A total of 106 luxury homes sold, up from 101 in July 2025. Inventory declined from 997 properties to 734, a 26% reduction. Months of supply fell from 9.4 months to 6.3 months.

That shift represents a meaningful improvement. The luxury segment moved away from the elevated supply conditions seen one year ago and closer to balance. However, 6.3 months of supply still gave buyers more leverage than they had in Sarasota County overall, where supply stood at 3.8 months.

Luxury real estate typically moves more slowly because the buyer pool is smaller and properties vary widely in location, design, age, waterfront access, and amenities. July’s results suggest that demand was absorbing inventory more effectively, but sellers still needed to compete carefully for qualified buyers.

Pricing Trends

Pricing data indicates strong activity at the upper end of the luxury market, although the reported figures are rounded to the nearest million and therefore provide limited precision.

The median sale price moved from approximately $1 million in July 2025 to approximately $2 million in July 2026. The average sale price increased from approximately $2 million to approximately $3 million.

Because these values are heavily rounded, they should not be interpreted as exact year-over-year appreciation rates. The increase in average price likely reflects a greater number of ultra-luxury closings, waterfront transactions, or other high-value properties within the monthly sales mix.

The large gap between median and average pricing also shows how a small number of very expensive transactions can influence the luxury average. Property-level comparisons remain more useful than broad averages when evaluating value in this segment.

Inventory Trends

Inventory conditions improved substantially for luxury sellers. The number of active listings declined by 263 properties from July 2025, reducing the amount of direct competition among high-end homes.

Months of supply fell by more than three months, from 9.4 to 6.3. This placed the luxury market near the boundary between balanced and buyer-leaning conditions.

The decline in supply matters because luxury buyers often compare several distinctive properties before making a decision. With fewer alternatives available, standout homes may receive more attention than they did last summer. Even so, 734 active listings still represented a broad selection, particularly compared with the extremely tight luxury inventory of 2021.

Inventory was therefore stabilizing rather than scarce. Sellers had a better environment than one year ago, but buyers retained the ability to be selective.

Market Pace

Luxury homes took longer to sell in July 2026, even as overall sales increased. Median days on market rose from 60 days in July 2025 to 77 days.

This mixed result suggests that demand improved, but buyers continued to move carefully. Luxury purchasers typically perform more extensive due diligence and often have highly specific expectations regarding construction quality, design, location, privacy, and waterfront features.

The increase in marketing time may also reflect the types of properties sold during the month. A larger share of distinctive or ultra-high-end homes can raise both average price and days on market.

Sellers should not interpret stronger sales as evidence that all luxury listings will move quickly. The segment still rewards properties that are correctly priced, well presented, and clearly differentiated from competing inventory.

What This Means for Buyers

Luxury buyers continue to have meaningful choice and negotiating power, especially when a property has been on the market for several months. Declining inventory means that the best-positioned homes may face more competition than they did last year. Buyers should focus on property-specific value, recent comparable sales, and the long-term importance of location and construction quality.

What This Means for Sellers

Luxury sellers benefit from lower inventory and improved sales activity, but the market still requires patience. Pricing should reflect recent comparable transactions rather than broad increases in average sale price. Professional presentation, accurate positioning, and a clear explanation of the property’s unique value remain essential for attracting qualified buyers.
Combined Market Data
Closed Sales Data
Closed Units
106
+5.0%
Median Price
$1,935,000
+36.7%
Average Price
$2,838,220
+34.0%
Median DOM
77
+28.3%
Pending Data
Pending Units
253
Median Price
$2,650,000
Average Price
$4,346,103
Median DOM
64
Inventory Data
Inventory Units
734
-26.4%
Median Price
$2,624,500
Average Price
$3,765,643
Median DOM
118
Months Supply
6.3
-33.2%
Luxury Threshold
Sarasota County
$1,300,000
+35.4%
Manatee County
$925,000
-3.6%
Single Family Homes
Closed Sales Data
Closed Units
72
-19.1%
Median Price
$2,012,500
+34.2%
Average Price
$2,869,778
+31.8%
Median DOM
76
+40.7%
Pending Data
Pending Units
112
Median Price
$2,000,000
Average Price
$3,603,638
Median DOM
110
Inventory Data
Inventory Units
512
-25.8%
Median Price
$2,697,000
Average Price
$3,893,948
Median DOM
108
Months Supply
6.0
-28.4%
Condos, Townhomes, Villas
Closed Sales Data
Closed Units
34
+183.3%
Median Price
$1,862,500
+59.5%
Average Price
$2,771,393
+64.4%
Median DOM
79
-45.5%
Pending Data
Pending Units
141
Median Price
$4,251,000
Average Price
$4,935,862
Median DOM
4
Inventory Data
Inventory Units
222
-27.7%
Median Price
$2,492,500
Average Price
$3,469,733
Median DOM
158
Months Supply
6.9
-45.3%
Explore the Full Report
THE ZARGHAMI REPORT

Source

Figures in this report are based on data from the My Florida Regional Multiple Listing Service (MLS).

Terms of Use

The information contained in this real estate market report is based on data available at the time of its creation and is provided for general informational purposes only. Certain data may be excluded from these calculations if it is determined to be the result of bulk reporting practices that do not represent the current market conditions. While we strive to ensure the accuracy and reliability of the data, we recommend that individuals independently verify any information before making financial or real estate-related decisions. We are not responsible or liable for any inaccuracies, errors, or omissions in the data provided, or for any actions taken in reliance upon this information.

Zarghami Group | KW Coastal Living III
401 N Cattlemen Road Suite 308
Sarasota, FL 34232
941-241-3622
Subscribe to our newsletter
The latest news, articles, and resources, sent to your inbox.
© 2025 Zarghami Group | KW Coastal Living III. All rights reserved.