THE ZARGHAMI REPORT

SARASOTA’S MOST CURRENT AND RELEVANT REAL ESTATE MARKET INFORMATION

East Sarasota Market Report

JUNE 2026

Market data for properties in northern Sarasota County east of I-75.
Updated July 6, 2026

Highlights

  • East Sarasota remained one of Sarasota County’s stronger submarkets in June 2026, supported by higher sales and relatively tight supply.
  • Pricing strengthened from last year, with both the median and average sale price moving higher.
  • Inventory declined modestly, but the bigger shift came from stronger buyer absorption.
  • Homes took longer to sell than last year, showing that buyers were active but still selective.
  • Sellers had a stronger position than in many Sarasota County areas, but pricing still needed to match current demand.

Market Conditions

East Sarasota showed a balanced to seller-leaning market in June 2026. The area had stronger sales activity than last year and a supply level below Sarasota County overall. That combination gave sellers more support than in several higher-inventory Sarasota submarkets.

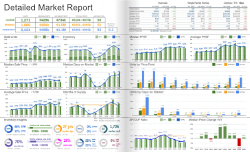
Closed sales increased to 138 in June 2026, up from 89 one year earlier. That was a significant increase and shows stronger buyer activity in the eastern part of the county. Active inventory declined to 386 homes, down from 412 in June 2025. With sales rising and inventory easing, months of supply fell from 4.4 months to 3.8 months.

That 3.8-month supply level was tighter than Sarasota County’s 4.2-month supply. East Sarasota was not in an extreme shortage, but it had less available supply relative to demand. This created a more competitive environment for well-priced homes, especially compared with coastal and luxury submarkets that carried higher inventory.

Pricing Trends

Pricing strengthened in East Sarasota in June. The median sale price rose to $697,000, up from $625,000 one year earlier. Because the median reflects the middle of the market, this points to a meaningful increase in typical closed-sale pricing.

The average sale price also increased, rising to $922,000 from $774,000 last June. Since the average can be influenced by higher-priced sales, this suggests that upper-end activity also played a role. The increase in both median and average prices gives the pricing trend more support than either metric would provide on its own.

Even with stronger pricing, the increase should not be read as uniform appreciation across every neighborhood or property type. East Sarasota includes a range of communities, acreage properties, newer homes, and higher-end neighborhoods, so sales mix can influence the numbers. Still, the combined pricing data points to a stronger market than last year.

Inventory Trends

Inventory edged lower, but sales growth was the bigger story. Active listings declined from 412 in June 2025 to 386 in June 2026. That was a modest reduction, yet it occurred alongside a large increase in closed sales.

Months of supply fell from 4.4 months to 3.8 months, placing East Sarasota in a tighter position than the county overall. This matters because buyers had fewer choices relative to the pace of demand. Sellers still faced competition, but the market had enough absorption to support properly priced listings.

Compared with the pandemic-era market, inventory was still much more normal. Buyers had options, but not an oversupply. This kept East Sarasota closer to a seller-leaning balance than a buyer-leaning one.

Market Pace

East Sarasota’s pace showed a mixed picture. Closed sales rose sharply, but median days on market increased to 48 days, up from 33 days last June. That means more homes sold, but buyers took longer to make decisions.

This type of pattern often points to a selective but active market. Buyers were willing to move forward, but they were not rushing into every listing. Condition, pricing, community, location, and overall value likely mattered more than they did during the fastest years of the market.

Even with the longer selling time, East Sarasota still moved faster than Sarasota County overall, which had a 54-day median. That supports the view that demand remained healthy, especially for homes that were well-positioned against current competition.

What This Means for Buyers

East Sarasota buyers had fewer choices relative to demand than buyers in several other Sarasota County markets. Well-priced homes could attract attention, so buyers needed to be prepared before making offers. There was still room to compare options, but buyers had less leverage than they did in higher-supply coastal and luxury areas.

What This Means for Sellers

East Sarasota sellers had a stronger market than many Sarasota County sellers, with rising sales, tighter supply, and stronger pricing. Still, the increase in days on market showed that buyers were not acting with unlimited urgency. Sellers needed to price against current competition, prepare the home carefully, and avoid assuming that stronger market conditions would overcome an ambitious asking price.
Combined Market Data
Closed Sales Data
Closed Units
138
+55.1%
Median Price
$696,941
+11.5%
Average Price
$922,214
+19.1%
Median DOM
48
+45.5%
Pending Data
Pending Units
164
Median Price
$744,495
Average Price
$873,756
Median DOM
49
Inventory Data
Inventory Units
386
-6.3%
Median Price
$702,130
Average Price
$922,587
Median DOM
55
Months Supply
3.8
-14.5%
Luxury Threshold
Sarasota County
$1,348,000
+34.8%
Manatee County
$914,750
-8.5%
Single Family Homes
Closed Sales Data
Closed Units
112
+77.8%
Median Price
$800,250
+1.3%
Average Price
$1,037,874
+13.3%
Median DOM
43
+2.4%
Pending Data
Pending Units
120
Median Price
$856,375
Average Price
$1,068,295
Median DOM
43
Inventory Data
Inventory Units
268
-24.5%
Median Price
$880,424
Average Price
$1,171,080
Median DOM
56
Months Supply
3.3
-34.6%
Condos, Townhomes, Villas
Closed Sales Data
Closed Units
26
+0.0%
Median Price
$376,500
-18.5%
Average Price
$423,988
-1.3%
Median DOM
72
+260.0%
Pending Data
Pending Units
44
Median Price
$340,815
Average Price
$343,196
Median DOM
53
Inventory Data
Inventory Units
118
+107.0%
Median Price
$336,950
Average Price
$358,213
Median DOM
50
Months Supply
5.7
+127.1%
Explore the Full Report
THE ZARGHAMI REPORT

Source

Figures in this report are based on data from the My Florida Regional Multiple Listing Service (MLS).

Terms of Use

The information contained in this real estate market report is based on data available at the time of its creation and is provided for general informational purposes only. Certain data may be excluded from these calculations if it is determined to be the result of bulk reporting practices that do not represent the current market conditions. While we strive to ensure the accuracy and reliability of the data, we recommend that individuals independently verify any information before making financial or real estate-related decisions. We are not responsible or liable for any inaccuracies, errors, or omissions in the data provided, or for any actions taken in reliance upon this information.

Zarghami Group | KW Coastal Living III
401 N Cattlemen Road Suite 308
Sarasota, FL 34232
941-241-3622
Subscribe to our newsletter
The latest news, articles, and resources, sent to your inbox.
© 2025 Zarghami Group | KW Coastal Living III. All rights reserved.