Highlights
-
Nokomis tightened through fewer listings and slightly more completed sales.
-
A higher median and lower average left pricing divided.
-
Available choice contracted more than countywide.
-
Marketing time improved but remained close to the county median.
-
Sellers gained support without a uniform rise in reported prices.
Market Conditions
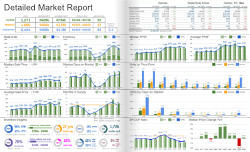
Nokomis tightened in October 2026 as completed sales increased slightly and available inventory declined. Its 3.2 months of supply supported a seller lean, though a divided pricing picture called for careful valuation.
The figures combine single-family homes, condos, townhomes, and villas. Comparisons are year over year, between October 2026 and October 2025.
Supply was below Sarasota County’s 4.2 months, while the 48-day marketing median was close to the county’s 46 days. Lower relative supply did not translate into a faster local median.
Pricing Trends
The median, the midpoint of completed sales, increased 3.7%, from $485,000 to $503,000. The average, which is more sensitive to expensive closings, declined 17.0%, from $792,000 to $657,000.
The opposing movements may reflect fewer or less expensive upper-end closings. They do not establish broad appreciation or decline, and the higher median should not be applied uniformly to individual homes.
Inventory Trends
Available inventory declined 22.8%, from 329 to 254 listings. Months of supply fell from 4.7 to 3.2, measuring available choice relative to the sales pace.
Buyers had 75 fewer listings to consider. The inventory contraction exceeded the county’s 14.4% decline, while supply was below October 2019’s 4.5 months but above October 2021’s 1.0 month.
Market Pace
Closed sales, which measure completed transactions, increased 3.2%, from 62 to 64. Median days on market fell from 57 to 48 days.
The 3.2% increase in closings contrasted with a small countywide decline. Marketing time improved by nine days, indicating firmer completed activity without the county’s larger improvement in selling speed.
What This Means for Buyers
Buyers have fewer choices and should assess a well-priced match promptly. Compare properties within the same neighborhood and price category. The split between median and average prices makes property-specific evidence more useful than either headline measure alone.
What This Means for Sellers
Sellers face less inventory competition and slightly more completed activity. Set pricing from similar local sales and prepare the home to compete with current alternatives. A higher median does not support a matching increase in every asking price.