Highlights
-
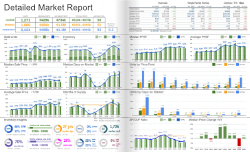
Sarasota’s completed sales increased sharply as inventory declined.
-
A lower median and much higher average showed a strongly divided pricing picture.
-
Supply moved toward balance but stayed above the countywide reading.
-
Marketing time improved modestly, much less dramatically than the closing count.
-
Sellers gained support from activity, while buyers needed to separate upper-end price influence from typical values.
Market Conditions
Sarasota moved toward balanced-to-seller-leaning conditions in September 2026. Its 4.2 months of supply remained above the county, while completed sales increased much faster. The reported city market is distinct from county and HLA boundaries, so its results should not be substituted for those broader areas.
The figures combine single-family homes, condos, townhomes, and villas, with year-over-year comparisons to September 2025.
The local supply reading compares with 3.7 months in Sarasota County.
Pricing Trends
The median sale price declined 19.5%, from $620,000 to $499,000. The average increased 49.0%, from $871,000 to $1,298,000. The median marks the midpoint of sales; the average gives expensive transactions more influence.
The median declined 19.5%, while the average increased 49.0%. A much higher average with a lower midpoint may reflect greater influence from expensive transactions within a changing sales mix. Neither measure establishes a uniform appreciation or decline rate for individual properties.
Inventory Trends
Available inventory declined 19.8%, from 2,744 to 2,201 properties. Months of supply declined from 6.1 to 4.2.
Buyers faced 543 fewer listings. The inventory contraction was smaller than the county’s 23.7% decline, and local supply remained slightly above September 2019’s 4.0 months. Choice narrowed, but the market retained more supply relative to activity than countywide.
Market Pace
Closed sales increased 72.4%, from 293 to 505. Median days on market fell from 65 to 59 days. Closed sales measure completed transactions rather than new contracts.
The 59-day median improved six days and was three days longer than the county’s 56 days. Closings increased 72.4%, much more than the county’s 33.8%. The gain in completed volume was therefore much greater than the improvement in selling speed.
What This Means for Buyers
Buyers should use neighborhood and property-category comparisons to interpret the split price measures. Fewer listings reduce alternatives, but the local supply reading still supports comparison. Do not treat the higher average as a matching increase in the price of every suitable home.
What This Means for Sellers
Sellers benefit from more completed activity and fewer competing listings. The lower median still calls for disciplined pricing based on comparable sales. Prepare the home carefully and plan around the local marketing period, which improved much less than the closing count.