Highlights
-
Central Sarasota tightened, but longer marketing times tempered its stronger sales result.
-
Median and average prices both fell sharply, warranting caution about changing sales mix.
-
Inventory declined while supply moved into balanced-to-seller-leaning territory.
-
Closings more than doubled, yet the median selling period lengthened.
-
Sellers faced less competition but could not assume tighter supply supported higher prices.
Market Conditions
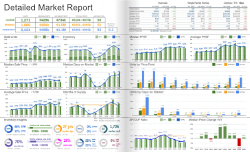
Central Sarasota moved toward balanced-to-seller-leaning conditions in September 2026. Its 4.0 months of supply was close to the county reading. More completed sales and fewer listings supported tighter balance, but lower sale prices and a longer marketing period made the overall picture mixed.
The figures combine single-family homes, condos, townhomes, and villas, with year-over-year comparisons to September 2025.
The local supply reading compares with 3.7 months in Sarasota County.
Pricing Trends
The median sale price declined 36.7%, from $600,000 to $380,000. The average declined 41.8%, from $735,000 to $428,000. The median marks the midpoint of sales; the average gives expensive transactions more influence.
Both measures shifted substantially lower: the median fell 36.7% and the average 41.8%. These are changes in the completed-sales distribution, not proof that the same homes lost that share of their value. September 2025 prices were also above the segment’s 2024 readings, making the comparison sensitive to the prior year’s sales mix.
Inventory Trends
Available inventory declined 14.8%, from 1,144 to 975 properties. Months of supply declined from 5.0 to 4.0.
The decline of 169 listings reduced buyer choice. Inventory was below September 2019’s 1,035 listings, while supply remained above that September’s 2.9 months. The two readings show why a smaller listing count alone does not establish a shortage.
Market Pace
Closed sales increased 104.0%, from 100 to 204. Median days on market rose from 51 to 59 days. Closed sales measure completed transactions rather than new contracts.
The 59-day median was slightly longer than the county’s 56 days. Sales increased 104.0%, but marketing time rose eight days. That combination shows more properties closing without a faster typical completed sale; the tables do not identify the reason.
What This Means for Buyers
Buyers should compare recent sales within the same property category before applying the large headline price declines to an offer. Selection has narrowed, but the longer marketing period supports careful evaluation. A four-month supply reading does not remove negotiation opportunities on listings that face comparable alternatives.
What This Means for Sellers
Sellers compete against fewer listings, but lower completed-sale prices require disciplined expectations. Set an asking price from comparable properties rather than assume last September’s prices remain representative. Allow for a marketing period that lengthened despite the stronger closing count.