THE ZARGHAMI REPORT

SARASOTA’S MOST CURRENT AND RELEVANT REAL ESTATE MARKET INFORMATION

Manatee Keys Market Report

JULY 2026

Market data for Anna Maria Island and the Manatee County portion of Longboat Key.
Updated August 5, 2026

Highlights

  • The Manatee Keys remained buyer-leaning as sales declined and months of supply stayed elevated.
  • Median pricing increased, while the sharp rise in average price reflected stronger activity at the very top of the market.
  • Buyers had more homes to choose from than one year ago and continued to benefit from substantial negotiating leverage.
  • Homes took significantly longer to sell, confirming a slower and more selective market.
  • Sellers faced challenging conditions despite higher pricing metrics because demand weakened and inventory remained high.

Market Conditions

The Manatee Keys softened in July 2026 as sales declined, inventory increased, and homes took considerably longer to sell.

Closed sales fell from 45 in July 2025 to 35 in July 2026, a decline of 22%. Active inventory increased slightly from 368 homes to 376, while months of supply declined from 9.1 months to 7.9 months.

The lower months-of-supply figure was an improvement, but 7.9 months still represented elevated inventory and clear buyer-leaning conditions. Buyers had substantial choice and time to compare properties, while sellers competed for a smaller pool of purchasers.

The Manatee Keys were much softer than Manatee County overall, which had 3.6 months of supply and stronger year-over-year sales. Coastal demand remained present, but buyers were moving carefully and had significant leverage.

Pricing Trends

Pricing results were influenced heavily by the mix of properties sold.

The median sale price increased 10%, from $750,000 in July 2025 to $825,000 in July 2026. The average sale price rose much more sharply, increasing from $931,000 to $1,743,000.

This large gap between median and average pricing indicates that a small number of very expensive transactions had a major effect on the monthly average. The increase does not suggest that all properties appreciated at the same pace.

Waterfront access, views, lot size, renovation quality, elevation, and boating amenities can create wide price differences across the Manatee Keys. With only 35 closed sales, a few ultra-luxury transactions can change the average substantially.

The higher median suggests that the midpoint of the market shifted upward, but property-specific comparable sales remain essential for determining value.

Inventory Trends

Inventory increased slightly, rising from 368 active listings to 376. Months of supply improved from 9.1 to 7.9 months because the broader sales pace used to calculate supply strengthened, but the overall level remained elevated.

Buyers continued to have a wide range of options. This gave them time to compare condition, flood exposure, insurance costs, waterfront features, and long-term maintenance requirements.

The slight inventory increase also meant sellers faced more direct competition than they did one year earlier. Properties that lacked updates, had deferred maintenance, or entered the market above comparable value were at greater risk of extended market time.

Supply was no longer as elevated as it was in July 2025, but it remained high enough to preserve strong buyer leverage.

Market Pace

The Manatee Keys were among the slowest local markets in July. Median days on market increased from 74 days in July 2025 to 126 days in July 2026.

That increase shows that buyers were taking more time and that some properties required substantial exposure before securing a contract. Coastal buyers often conduct detailed due diligence involving insurance, flood zones, structural condition, seawalls, docks, and renovation needs.

The decline in closed sales reinforces the slower pace. Demand did not disappear, but it became more selective and concentrated among properties that clearly justified their price.

Long market times gave buyers room to negotiate, while sellers needed realistic expectations about timing and concessions.

What This Means for Buyers

Buyers have substantial choice, limited urgency, and meaningful negotiating power. Extended market times may create opportunities to negotiate on price, repairs, furnishings, or closing terms. Careful due diligence remains essential because insurance, flood exposure, structural condition, and waterfront maintenance can significantly affect long-term ownership costs.

What This Means for Sellers

Sellers face a competitive market with elevated supply and slower demand. Higher median and average prices should not be treated as evidence that every property can support a higher asking price. Accurate pricing, complete property documentation, strong presentation, and realistic expectations about marketing time are critical.
Combined Market Data
Closed Sales Data
Closed Units
35
-22.2%
Median Price
$825,000
+10.0%
Average Price
$1,743,339
+87.2%
Median DOM
126
+70.3%
Pending Data
Pending Units
48
Median Price
$1,037,500
Average Price
$1,615,890
Median DOM
123
Inventory Data
Inventory Units
376
+2.2%
Median Price
$1,584,500
+2.4%
Average Price
$2,639,403
+12.9%
Median DOM
126
Months Supply
7.9
-13.8%
Luxury Threshold
Sarasota County
$1,300,000
+35.4%
Manatee County
$925,000
-3.6%
Single Family Homes
Closed Sales Data
Closed Units
15
-37.5%
Median Price
$1,800,000
+60.4%
Average Price
$3,183,167
+146.6%
Median DOM
122
+10.9%
Pending Data
Pending Units
27
Median Price
$1,449,000
Average Price
$2,174,589
Median DOM
144
Inventory Data
Inventory Units
241
-4.0%
Median Price
$2,900,000
+17.2%
Average Price
$3,726,235
+24.2%
Median DOM
140
Months Supply
8.8
-19.7%
Condos, Townhomes, Villas
Closed Sales Data
Closed Units
20
-4.8%
Median Price
$507,500
+6.8%
Average Price
$663,468
+27.5%
Median DOM
144
+227.3%
Pending Data
Pending Units
21
Median Price
$600,000
Average Price
$897,562
Median DOM
98
Inventory Data
Inventory Units
135
+15.4%
Median Price
$649,000
-0.2%
Average Price
$699,208
-0.2%
Median DOM
99
Months Supply
6.6
-1.6%
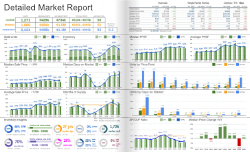
Explore the Full Report
THE ZARGHAMI REPORT

Source

Figures in this report are based on data from the My Florida Regional Multiple Listing Service (MLS).

Terms of Use

The information contained in this real estate market report is based on data available at the time of its creation and is provided for general informational purposes only. Certain data may be excluded from these calculations if it is determined to be the result of bulk reporting practices that do not represent the current market conditions. While we strive to ensure the accuracy and reliability of the data, we recommend that individuals independently verify any information before making financial or real estate-related decisions. We are not responsible or liable for any inaccuracies, errors, or omissions in the data provided, or for any actions taken in reliance upon this information.

Zarghami Group | KW Coastal Living III
401 N Cattlemen Road Suite 308
Sarasota, FL 34232
941-241-3622
Subscribe to our newsletter
The latest news, articles, and resources, sent to your inbox.
© 2025 Zarghami Group | KW Coastal Living III. All rights reserved.