Highlights
-
Palmetto & Ellenton remained near the county’s balance reading with little change in completed activity.
-
A higher median and lower average produced mixed pricing.
-
Inventory increased, giving buyers additional listings despite lower supply months.
-
Marketing time changed little and stayed faster than the county median.
-
Sellers faced more active competition, keeping leverage measured rather than absolute.
Market Conditions
Palmetto & Ellenton showed balanced-to-seller-leaning conditions in September 2026. Its 3.4 months of supply was close to the county, but available listings increased. Nearly steady sales and marketing time made additional listing choice more significant than the lower supply reading alone.
The figures combine single-family homes, condos, townhomes, and villas, with year-over-year comparisons to September 2025.
The local supply reading compares with 3.5 months in Manatee County.
Pricing Trends
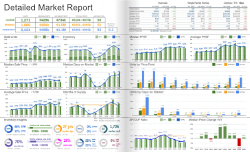
The median sale price increased 4.8%, from $375,000 to $393,000. The average declined 2.0%, from $452,000 to $443,000. The median marks the midpoint of sales; the average gives expensive transactions more influence.
The median increased 4.8%, while the average declined 2.0%. The opposing movements may reflect a different sales mix and do not establish uniform appreciation. The local median remained below the county’s $420,000 despite its larger percentage increase.
Inventory Trends
Available inventory increased 6.2%, from 433 to 460 properties. Months of supply declined from 4.1 to 3.4.
The addition of 27 listings contrasted with Manatee County’s 10.3% inventory decline. Supply depends on the source’s sales-rate calculation, so its decline should not be described as fewer homes available. Buyers actually had a larger listing pool.
Market Pace
Closed sales declined 2.0%, from 98 to 96. Median days on market rose from 41 to 42 days. Closed sales measure completed transactions rather than new contracts.
The 42-day median was 11 days shorter than the county’s 53 days. Closings declined 2.0%, and marketing time rose only one day. Completed activity and selling speed were nearly steady despite the change in supply months.
What This Means for Buyers
Buyers have more alternatives than last September and a relatively quick local pace. Compare similar completed sales to interpret the split price measures. Assess a good match promptly while using the larger active listing pool to evaluate competing options and negotiation.
What This Means for Sellers
Sellers face more competing listings even though supply months declined. Nearly steady closings and marketing time support measured expectations. Price against matching completed sales and prepare the property to compete with the additional inventory, rather than assume the higher median guarantees a premium.