Highlights
-
The region tightened, but Sarasota accounted for the increase in completed sales while Manatee activity eased.
-
A lower regional median and a higher average reveal a divided pricing picture rather than a uniform rise in values.
-
Fewer available homes reduced buyer choice in both counties, with the larger contraction in Sarasota.
-
Marketing times shortened across both counties but remained much longer than during the 2021 shortage.
-
Sellers gained support from lower supply, while buyers retained more room in coastal and luxury segments.
Market Conditions
The Sarasota and Manatee County market moved toward tighter, seller-leaning balance in September 2026. A smaller inventory and shorter marketing times improved sellers’ position, but the counties followed different paths. Sarasota recorded a large increase in completed sales, while Manatee closed slightly fewer transactions. The figures combine single-family homes, condos, townhomes, and villas, with year-over-year comparisons to September 2025.
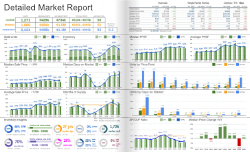
Months of supply estimates available inventory relative to the sales pace. Regional supply fell from 5.0 to 3.6 months, moving from the upper end of balance toward a seller lean. Sarasota carried 3.7 months and Manatee 3.5 months. Those similar readings mask differences in local sales activity and pricing.
The longer September history places this market well beyond the extreme shortage of 2021, when regional supply was 0.9 months. Current supply is close to the 3.5 months recorded in September 2019, but homes now take longer to sell. That combination supports a tighter market without implying a return to pandemic-era urgency.
Pricing Trends
The median is the midpoint of completed sales, while the average is more sensitive to expensive transactions. The regional median declined 1.2% from $430,000 to $425,000. The average increased 28.1% from $577,000 to $739,000. These opposing movements do not establish broad appreciation or a uniform decline in individual home values.
Sarasota supplied the largest pricing contrast: its median fell 4.9% to $428,000 while its average rose 41.7% to $911,000. Its luxury segment and Keys also recorded much higher averages, supporting the possibility that expensive closings influenced the regional result. Manatee’s median rose 1.2% to $420,000 and its average increased 4.2% to $544,000.
Inventory Trends
Available inventory measures buyer choice and competition among sellers. Regional inventory declined 17.9%, from 9,524 properties to 7,821. Sarasota inventory fell 23.7% to 4,125, while Manatee inventory declined 10.3% to 3,696.
The reduction was uneven within the counties. South Sarasota County carried 3.3 months of supply, compared with 6.1 months in West Sarasota & Downtown. East Manatee had 2.9 months, while the Manatee Keys had 6.4 months. Buyers and sellers should therefore use the conditions in their own segment rather than apply the regional balance to every property.
Market Pace
Closed sales measure completed activity. Regional closings increased 14.1%, from 1,629 to 1,859, with Sarasota rising 33.8% to 989 and Manatee declining 2.2% to 870. The regional increase was therefore concentrated in Sarasota rather than shared equally across both counties.
Median days on market fell from 71 to 54 days. Sarasota improved from 76 to 56 days, and Manatee from 66 to 53 days. The regional median remained above September 2019’s 47 days and far above September 2021’s five days. Pending-sales data was not supplied, so completed sales cannot establish whether new contract activity is accelerating.
What This Means for Buyers
Buyers have fewer alternatives, especially in areas with supply below three months. Compare recent sales within the same neighborhood and property category before using a regional price change to guide an offer. Shorter marketing times support acting promptly on a good match, while higher-supply coastal and luxury segments still allow more comparison and negotiation.
What This Means for Sellers
Sellers face less inventory competition, but their leverage depends on location and price range. Sarasota’s higher average does not justify a matching increase in every asking price. Use comparable completed sales, prepare the property carefully, and set timing expectations from the local market rather than the regional sales increase.