Highlights
-
Completed sales surged, but a longer marketing time kept conditions mixed.
-
A lower median and higher average show a divided sales distribution.
-
Inventory declined and supply moved away from last year’s elevated level.
-
Homes took longer to sell despite the increase in closings.
-
Buyers retained more negotiating room than the countywide supply reading would suggest.
Market Conditions
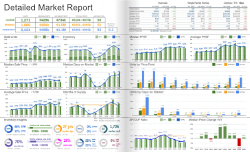
West Sarasota & Downtown improved from elevated supply to balanced-to-buyer-leaning conditions in September 2026. Its 6.1 months of supply remained well above the county. More completed sales supported sellers, but the longer median marketing time prevented a clear shift toward seller control.
The figures combine single-family homes, condos, townhomes, and villas, with year-over-year comparisons to September 2025.
The local supply reading compares with 3.7 months in Sarasota County.
Pricing Trends
The median sale price declined 12.9%, from $918,000 to $800,000. The average increased 48.9%, from $1,134,000 to $1,689,000. The median marks the midpoint of sales; the average gives expensive transactions more influence.
The median declined 12.9%, while the average increased 48.9%. The divergence may reflect a different distribution of sales, including greater influence from expensive transactions. It does not support a single appreciation or decline rate for the area’s properties.
Inventory Trends
Available inventory declined 26.2%, from 561 to 414 properties. Months of supply declined from 12.7 to 6.1.
The smaller listing pool reduced sellers’ competition, but buyers still had substantial supply relative to activity. Current supply was close to September 2023’s 6.0 months and below September 2019’s 8.0 months. The segment remained less constrained than the county overall.
Market Pace
Closed sales increased 211.5%, from 26 to 81. Median days on market rose from 88 to 94 days. Closed sales measure completed transactions rather than new contracts.
Closings rose from a small prior-year base, increasing 211.5%. However, the 94-day median was 38 days longer than the county’s 56 days and six days longer than last September. A surge in completed volume did not mean that the typical sale moved faster.
What This Means for Buyers
Buyers can compare competing properties and use longer marketing times to inform negotiation. Fewer listings mean fewer alternatives, but 6.1 months of supply still supports selectivity. Judge value from matching completed sales instead of treating the higher average as a marketwide price increase.
What This Means for Sellers
Sellers have less inventory competition and substantially more completed activity. Still, longer marketing time and a lower median call for realistic pricing and timing. Prepare the property well and evaluate similar active listings because buyers retain more choice than in the broader county.