Highlights
-
Osprey’s lower supply reading contrasted with a much longer marketing period.
-
Both price measures fell sharply within a small set of completed sales.
-
Inventory contracted, reducing the listing pool despite slower sales speed.
-
More closings did not mean faster transactions, with median marketing time reaching 130 days.
-
Buyers retained room for careful comparison while sellers needed patient, disciplined expectations.
Market Conditions
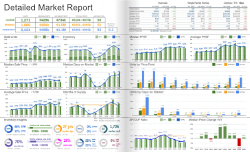
Osprey presented mixed conditions in September 2026. Its 4.4 months of supply suggested balanced-to-seller-leaning availability, but the 130-day median marketing period was far slower than the county. Only 16 sales closed, making the comparison sensitive to a small sales distribution.
The figures combine single-family homes, condos, townhomes, and villas, with year-over-year comparisons to September 2025.
The local supply reading compares with 3.7 months in Sarasota County.
Pricing Trends
The median sale price declined 50.7%, from $1,275,000 to $628,000. The average declined 41.4%, from $1,330,000 to $780,000. The median marks the midpoint of sales; the average gives expensive transactions more influence.
The median declined 50.7%, and the average fell 41.4%. Both shifted sharply lower, but the comparison involves 16 sales versus nine last year. Different homes and price ranges may have contributed substantially; these figures cannot establish equivalent value losses for individual properties.
Inventory Trends
Available inventory declined 26.7%, from 120 to 88 properties. Months of supply declined from 7.0 to 4.4.
There were 32 fewer listings, and supply fell below September 2019’s 5.5 months. Reduced inventory eased sellers’ competition, but it did not translate into a faster median completed sale. Supply and speed therefore need separate interpretation.
Market Pace
Closed sales increased 77.8%, from 9 to 16. Median days on market rose from 10 to 130 days. Closed sales measure completed transactions rather than new contracts.
Closings increased 77.8% from a small base, while marketing time rose 120 days. The 130-day median was 74 days longer than the county’s 56 days. More transactions completed, but the typical completed sale took much longer.
What This Means for Buyers
Buyers can use longer marketing times to support careful comparison and negotiation. Fewer listings reduce alternatives, but the headline price declines should not become an automatic discount on every home. Use closely matched recent sales because the sample is small.
What This Means for Sellers
Sellers face fewer competitors, but the much longer marketing period requires realistic timing. Price against similar completed properties and prepare for continued negotiation. Do not assume the higher closing count signals a faster market or that last year’s small sample sets current value.