THE ZARGHAMI REPORT

SARASOTA’S MOST CURRENT AND RELEVANT REAL ESTATE MARKET INFORMATION

Sarasota Keys Market Report

JUNE 2026

Market data for Bird Key, Casey Key, Lido Key, Siesta Key, and the Sarasota County portion of Longboat Key.
Updated July 6, 2026

Highlights

  • The Sarasota Keys market improved from last year as sales rose sharply and inventory declined.
  • Pricing was mixed, with the median sale price nearly flat while the average price moved higher.
  • Supply remained elevated compared with Sarasota County overall, but conditions were less buyer-leaning than last June.
  • Homes took longer to sell, showing that buyers remained selective despite stronger sales activity.
  • Sellers saw better demand, but waterfront and island pricing still required careful positioning.

Market Conditions

The Sarasota Keys market showed stronger activity in June 2026, but it remained more supplied than Sarasota County overall. The improvement was important because sales increased while inventory declined, reducing some of the pressure that built during 2025.

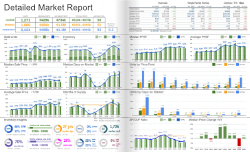
Closed sales rose to 108 in June 2026, up from 73 one year earlier. That was a significant gain and shows that buyers were more active across the barrier island and waterfront markets. Inventory declined to 637 active listings, down from 692 in June 2025. Together, those changes brought months of supply down from 9.9 months to 6.9 months.

That shift moved the Sarasota Keys closer to balance, but the area still had more supply than the broader county market, which had 4.2 months of supply. This means buyers had more leverage on the Keys than they did countywide. Sellers were in a better position than last year, but the market still rewarded accurate pricing and strong property presentation.

Pricing Trends

Pricing in the Sarasota Keys was mixed in June. The median sale price was $1,098,000, nearly unchanged from $1,100,000 one year earlier. Since the median reflects the middle of the market, this suggests that typical pricing held steady rather than moved sharply higher or lower.

The average sale price increased to $1,758,000, up from $1,556,000 last June. Because average price is more sensitive to high-end sales, that increase likely reflects stronger activity among higher-priced waterfront, newer, or premium island properties.

The difference between the flat median price and higher average price is important. It suggests that the overall market did not rise evenly across every price point. Instead, the upper end of the Sarasota Keys market likely had more influence on the average, while the middle of the market remained stable.

Inventory Trends

Inventory improved, but supply was still elevated. Active listings declined from 692 in June 2025 to 637 in June 2026. That decrease gave sellers less competition than they faced last year and helped reduce months of supply.

Months of supply fell from 9.9 months to 6.9 months. This was a major improvement, but a supply level near 7 months still gives buyers room to compare homes and negotiate. Compared with Sarasota County overall, the Keys remained meaningfully more supplied.

This matters because island and waterfront properties often have a more specialized buyer pool. Buyers may wait for the right view, location, condition, boating access, or renovation level. Sellers need to understand their direct competition instead of relying only on broad county trends.

Market Pace

The Sarasota Keys market did not move faster despite stronger sales activity. Median days on market increased to 76 days, up from 60 days one year earlier. That shows buyers were active, but they were taking more time before committing.

This slower pace is consistent with a higher-supply market. Buyers had enough options to be selective, especially at higher price points. Properties that were priced correctly and matched current buyer expectations could still sell, but listings that were ambitious on price were more likely to sit.

The rise in closed sales is encouraging, but the longer market time shows that demand was not urgent across the board. The Sarasota Keys market improved, but it remained selective.

What This Means for Buyers

Sarasota Keys buyers had fewer listings than they did last year, but they still had more negotiating room than buyers in tighter parts of Sarasota County. The best waterfront and island properties could draw stronger interest, especially when priced well. Buyers still had time to compare options, but they needed to act decisively when a property offered the right mix of location, condition, and value.

What This Means for Sellers

Sarasota Keys sellers had stronger demand than they did in June 2025, but the market was not tight. Elevated supply and longer days on market meant buyers continued to evaluate value carefully. Sellers needed precise pricing, strong presentation, and a clear understanding of how their home compared with nearby island and waterfront alternatives.
Combined Market Data
Closed Sales Data
Closed Units
108
+47.9%
Median Price
$1,097,500
-0.2%
Average Price
$1,758,444
+13.0%
Median DOM
76
+26.7%
Pending Data
Pending Units
135
Median Price
$1,699,000
Average Price
$3,748,296
Median DOM
107
Inventory Data
Inventory Units
637
-7.9%
Median Price
$1,325,000
Average Price
$2,776,576
Median DOM
98
Months Supply
6.9
-30.6%
Luxury Threshold
Sarasota County
$1,348,000
+34.8%
Manatee County
$914,750
-8.5%
Single Family Homes
Closed Sales Data
Closed Units
33
+37.5%
Median Price
$2,425,000
+46.2%
Average Price
$3,254,780
+38.1%
Median DOM
75
-1.3%
Pending Data
Pending Units
45
Median Price
$2,680,950
Average Price
$3,788,437
Median DOM
153
Inventory Data
Inventory Units
238
-16.5%
Median Price
$3,865,000
Average Price
$5,153,460
Median DOM
101
Months Supply
7.9
-21.1%
Condos, Townhomes, Villas
Closed Sales Data
Closed Units
75
+53.1%
Median Price
$775,000
+4.9%
Average Price
$1,100,057
-5.4%
Median DOM
76
+46.2%
Pending Data
Pending Units
90
Median Price
$1,377,500
Average Price
$3,728,226
Median DOM
81
Inventory Data
Inventory Units
399
-2.0%
Median Price
$829,000
Average Price
$1,358,786
Median DOM
98
Months Supply
6.4
-35.1%
Explore the Full Report
THE ZARGHAMI REPORT

Source

Figures in this report are based on data from the My Florida Regional Multiple Listing Service (MLS).

Terms of Use

The information contained in this real estate market report is based on data available at the time of its creation and is provided for general informational purposes only. Certain data may be excluded from these calculations if it is determined to be the result of bulk reporting practices that do not represent the current market conditions. While we strive to ensure the accuracy and reliability of the data, we recommend that individuals independently verify any information before making financial or real estate-related decisions. We are not responsible or liable for any inaccuracies, errors, or omissions in the data provided, or for any actions taken in reliance upon this information.

Zarghami Group | KW Coastal Living III
401 N Cattlemen Road Suite 308
Sarasota, FL 34232
941-241-3622
Subscribe to our newsletter
The latest news, articles, and resources, sent to your inbox.
© 2025 Zarghami Group | KW Coastal Living III. All rights reserved.