Highlights
-
Manatee tightened mainly through lower inventory, while completed sales slipped slightly.
-
The median and average rose modestly, creating a steadier price picture than Sarasota’s split results.
-
County inventory declined, but North Manatee County added listings and remained a distinct pocket of greater choice.
-
Marketing time shortened countywide, with East and Central Manatee showing stronger improvements.
-
The county leaned toward sellers overall, while Keys and luxury buyers retained more negotiating room.
Market Conditions
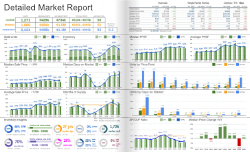
Manatee County moved toward tighter, seller-leaning balance in September 2026, even though completed sales declined slightly. Months of supply fell from 4.5 to 3.5 as inventory contracted. Unlike Sarasota’s sharp increase in closings, Manatee’s change in balance came alongside nearly steady completed activity. The figures combine single-family homes, condos, townhomes, and villas, with year-over-year comparisons to September 2025.
Manatee’s 3.5 months of supply was close to the regional reading of 3.6 months and below Sarasota’s 3.7 months. Those small differences do not establish a dramatic leverage advantage. Local conditions matter more: East Manatee carried 2.9 months, while the Manatee Keys had 6.4 months and the county’s luxury segment had 6.1 months.
Current supply also resembles the 3.3 months recorded in September 2019 more closely than the 0.9 months of September 2021. Inventory remained above its 2019 level, and the 53-day median marketing time exceeded 2019’s 47 days. The county has tightened from last year’s conditions without returning to an extreme shortage.
Pricing Trends
The median sale price, which marks the middle of completed sales, increased 1.2% from $415,000 to $420,000. The average increased 4.2% from $522,000 to $544,000. Both measures moved higher, but the larger average increase leaves room for changes in the mix of expensive and lower-priced properties sold.
This was a much steadier result than Sarasota’s lower median and sharply higher average. Manatee’s median was close to Sarasota’s $428,000, while its average remained well below Sarasota’s $911,000. County averages should therefore be interpreted with their sales distributions in mind.
Local pricing remained mixed. North Manatee County and Central Manatee & Bradenton recorded lower median and average prices. The Manatee Keys and luxury segment recorded increases in both. These differences prevent the countywide gains from being read as appreciation shared by every neighborhood or home.
Inventory Trends
Available inventory declined 10.3%, from 4,122 to 3,696 properties. That removed 426 competing listings, but the decline was smaller than Sarasota’s 23.7% reduction and the region’s 17.9% reduction. Buyers had less countywide selection while retaining more options in certain areas.
Central Manatee & Bradenton inventory fell 23.6%, and East Manatee inventory declined 19.1%. North Manatee County moved the other way, rising 11.8%. Its lower months-of-supply reading should be considered alongside that larger listing pool rather than treated as proof of shrinking buyer choice.
Months of supply is a relationship between inventory and the source’s sales pace, rather than a count of listings. It need not move in the same direction as inventory or the current month’s closings. The supplied readings show tighter balance.
Market Pace
Closed sales declined 2.2%, from 890 to 870, contrasting with Sarasota’s 33.8% increase. Manatee still recorded more September closings than in 2019, when 697 properties sold, but fewer than in September 2020.
Median days on market fell from 66 to 53 days, indicating a faster completed-sales pace despite slightly fewer closings. East Manatee improved from 85 to 49 days, and Central Manatee & Bradenton from 59 to 44 days. The Manatee Keys moved in the opposite direction, rising from 82 to 171 days, so countywide speed did not describe every segment.
What This Means for Buyers
Buyers should expect fewer alternatives in much of the county, especially East and Central Manatee. North Manatee County offers a larger inventory pool, while coastal and luxury segments retain higher supply relative to sales. Base negotiation on local comparable closings and marketing time rather than assume the county’s modest price gains apply equally to every listing.
What This Means for Sellers
Sellers have less countywide competition, but slightly fewer closings limit the case for aggressive price increases. Price against current comparable sales and account for competing inventory in the same segment. Coastal and luxury sellers should allow for more buyer choice, while North Manatee sellers face additional listings despite a lower supply reading.