Highlights
-
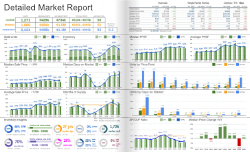
West Manatee tightened through fewer listings despite a decline in closings.
-
A higher median and lower average created a mixed pricing result.
-
Inventory contracted more than the countywide pool, but supply remained higher.
-
Marketing time improved modestly while remaining slower than the county.
-
Seller competition eased, though buyers retained more alternatives relative to sales than countywide.
Market Conditions
West Manatee moved into balanced-to-seller-leaning conditions in September 2026. Its 4.6 months of supply was lower than last year but above the county reading. Fewer listings improved sellers’ position, while lower closings and a slower local marketing pace moderated that advantage.
The figures combine single-family homes, condos, townhomes, and villas, with year-over-year comparisons to September 2025.
The local supply reading compares with 3.5 months in Manatee County.
Pricing Trends
The median sale price increased 5.1%, from $333,000 to $350,000. The average declined 2.8%, from $398,000 to $387,000. The median marks the midpoint of sales; the average gives expensive transactions more influence.
The median increased 5.1%, while the average declined 2.8%. Those opposing movements do not indicate uniform appreciation or decline. They may reflect a different sales mix within the area west of 26th Street West and south of the Manatee River. The local median remained below the county’s $420,000.
Inventory Trends
Available inventory declined 18.3%, from 853 to 697 properties. Months of supply declined from 6.1 to 4.6.
Buyers had 156 fewer active listings to consider. The inventory decline exceeded the county’s 10.3% reduction, but local supply remained above September 2019’s 2.9 months. Sellers faced less competition than last year without the tightness of the earlier market.
Market Pace
Closed sales declined 6.2%, from 129 to 121. Median days on market fell from 69 to 64 days. Closed sales measure completed transactions rather than new contracts.
The 64-day median was 11 days longer than the county’s 53 days, despite a five-day improvement. Closings declined 6.2%, more than the county’s 2.2% decline. The area became faster and less crowded with listings without showing stronger completed-sales volume.
What This Means for Buyers
Buyers have fewer alternatives but still face higher supply and longer marketing times than countywide. Use recent comparable sales to interpret the split price measures. A well-supported offer can account for the specific listing’s competition rather than assume every home commands a premium because the median rose.
What This Means for Sellers
Sellers benefit from less listing competition and slightly faster marketing time. Lower closings and the mixed pricing result call for measured expectations. Prepare the home carefully and price against similar completed sales, with timing that reflects a slower pace than the county overall.